Image viewers
Images in ACQ4 are often displayed alongside controls for changing the contrast, brightness, and coloration of the image data. Images come come in a variety of data types (very often 16/32-bit integer of floating-point) and thus must be transformed in order to be displayed within the 3-color, 8-bit color space that is typical of computer screens. This transformation happens in 2 stages:
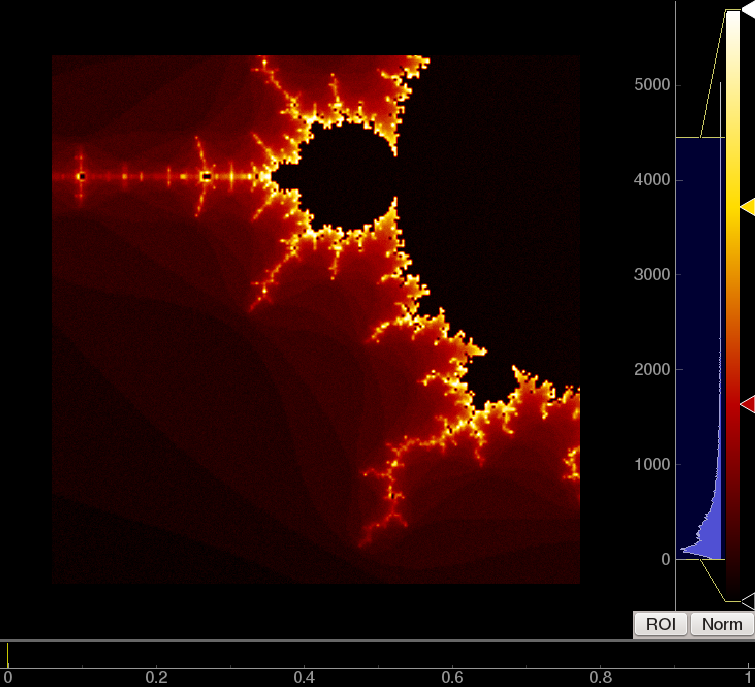
The data is passed through a scaling and offset function (X’ = scale * X + offset) to map a chosen minimum and maximum value onto a fixed set of integers. This mapping is represneted by a plot showing a histogram of the values in the image data with two lines indicating the minimum and maximum values in the mapping. For example, the figure below shows an image with values spanning the range from 0 to 5000. The yellow lines indicate that only the data from 0 to 4400 will be mapped to varying screen colors (that is, everything less than 0 in the image data will appear black, and everything greater than 4400 will appear white).
The mapped integer values are then converted to 32-bit RGBA color values using a color lookup table that is defined using a color gradient editor (shown at the right side of the figure below).
Color gradients may be specified as follows:
- Right-click on the color gradient to select from a pre-generated set of color gradients.
- Left-click on a triangular color marker to change the color for that location in the gradient.
- Left-click on between color markers to add a new marker.
- Right click on a color marker to remove it.
- Drag the mouse to move a color marker to a new location.
3-Dimensional image data
Image stacks and video data are often displayed with a “time” axis below the image, as in the figure above. This indicates that the image viewer is displaying one frame in a sequence. To view other frames in the sequence:
- Drag the yellow marker to a new location along the time line; the frame display will update as the marker is moved.
- Use the left/right arrow keys to scan forward/backward through the frames one at a time.
- Use the pgup/pgdn keys to scan more quickly through the frames.
- Use the home/end keys to skip to the beginning/end of the seqence.
- If the sequence includes timing information, press the spacebar to play the sequence in real-time.
ROI analysis
Most image viewers also provide an ROI (region of interest) button that provides a quick and simple analysis for image and video data. When this button is pressed, a square ROI will appear that can be dragged and resized with the mouse. At the same time, a plot appears displaying information about the image profile within the ROI. For 2D images, the data within the ROI is averaged top-to-bottom, and the resulting 1D array is plotted. For 3D images, the data within the entire ROI is averaged for each frame, als resulting in a 1D array that is plotted.
Image normalization
Pressing the Norm button reveals a set of image normalization controls that are used to perform a variety of background subtraction tasks useful for analysis of video data. (Note that these features are only meant to provide immediate access to some common online-analysis tasks; more thorough and detailed image analysis procedures are implemented in the ImageAnalysis module and in other applications.)
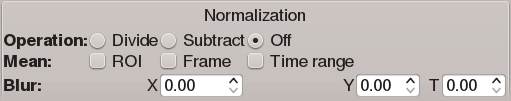
By selecting either Divide or Subtract, one or more of the following background corrections may be applied:
- ROI causes a new ROI to be displayed. The image values within this ROI are averaged per-frame, and the resulting value s are used to normalize each frame. This is used to remove time-varying background signals such as fluctuations in illumination level.
- Frame causes each frame to be normalized by its own mean. This is similar to using ROI normalization, but uses the entire frame instead of a select region.
- Time range causes a linear selection region to be displayed on the timeline. The frames within this region are averaged across time to yield a 2D ‘background’ image, which is then subtracted or divided from each frame in the sequence. This is used to remove time-invariant spatial structure from the signal, thus emphasizing signals that vary in time.