Some features in kuEye:
- Video image filtering (affects video display but not plot data):
- Brightness/Contrast
- Absolute value (awesome for speckle interferometry)
- Data filtering (affects video display and plot data)
- Exponential averaging
- Background subtraction
- Extended plotting functionality:
- Plot regions have arbitrary dimensions and rotation
- Plots update in realtime
- Standard 2D mode--plots across X and averages Y intensity
- 3D surface plots of intensity (fast openGL rendering)
- Waveform mode--averages entire plot region and plots intensity vs. time
- Additional features:
- Auto scale output based on sensor dimensions or ruler detection
- Region of interest allows much faster framerates
Example Uses
I have been an adjunct instructor at Colorado School of Mines thae past two years and have used this software for numerous experiments in the advanced physics lab. Below are some examples of the way we have used this software for our experiments.
LED Interferometry - measuring coherence
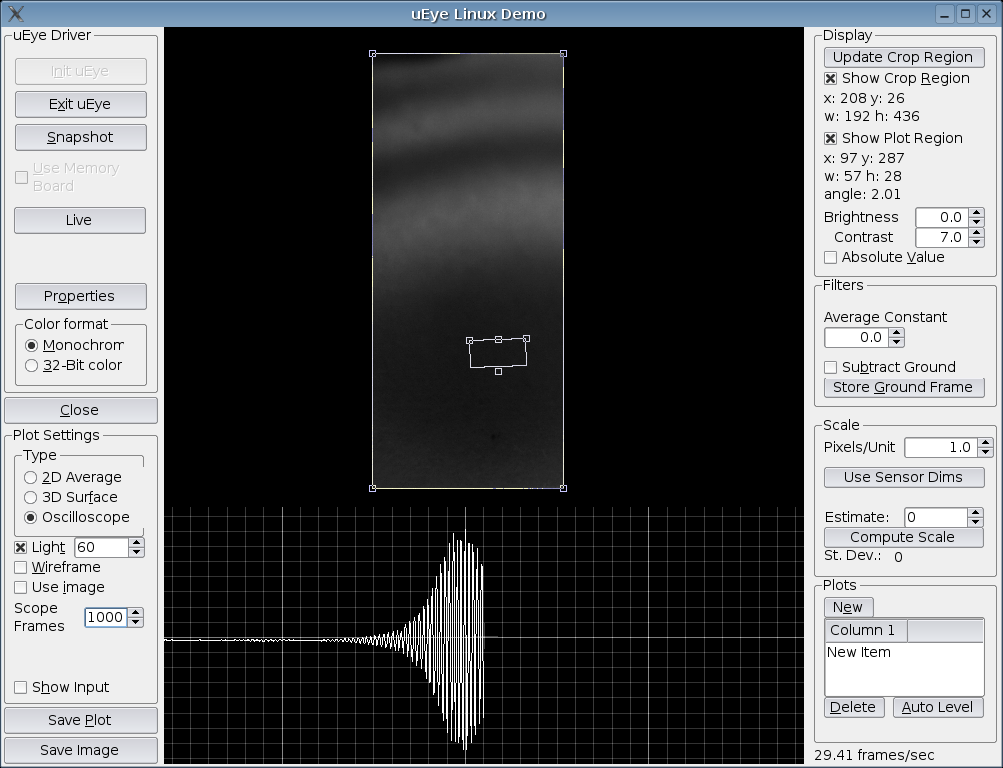
In this experiment, we looked at the interference produced by a Michelson interferometer and recorded a plot of intensity vs time. The image to the right shows the plot half way through capture. The region of interest was reduced to increase the framerate and therefore the time resolution of the plot. Also, the plot was extended to hold 1000 frames of data to cover the full length of the coherence pattern.
Speckle Interferometry
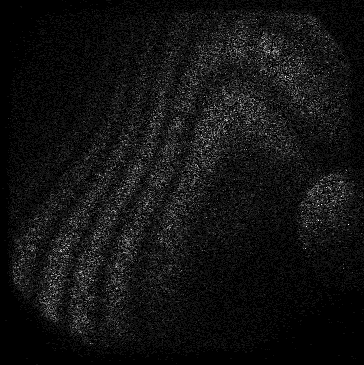
This is a standard speckle interferometry experiment made possible by using the background subtraction filter, increasing the contrast to about 30, and enabling the "absolute value" option. The image to the right is of a piece of paper. The fringes represent a topgraphical map of the distance the paper moved after the background frame was recorded. The motion is due to air currents in the room, and we could see the paper deforming in realtime.
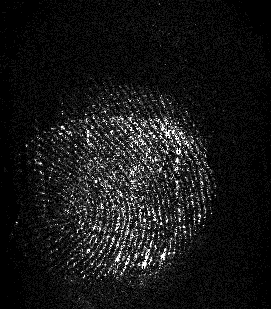
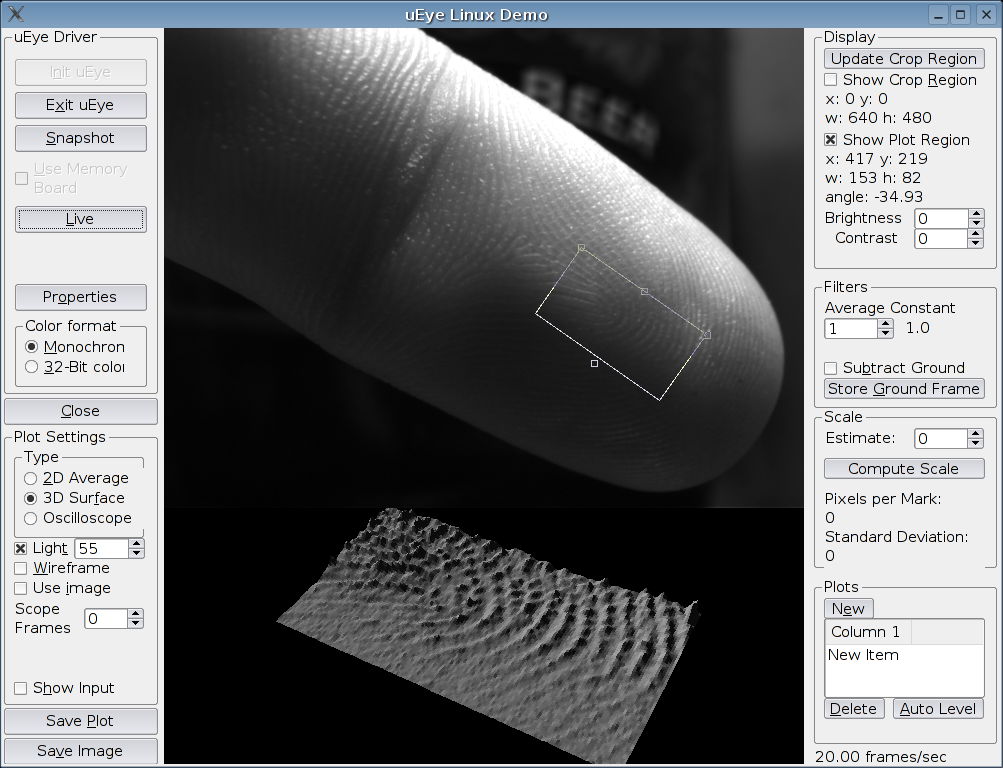
Along the same lines, we can see minute differences in surfaces simply by altering the speckle pattern from laser illumination. The image to the right is a fingerprint which is visible because the oils left behind are thick enough to change the speckle pattern. Note that no interferometry was used, so we don't expect a topographical map like above, just bright areas where the surface has changed.
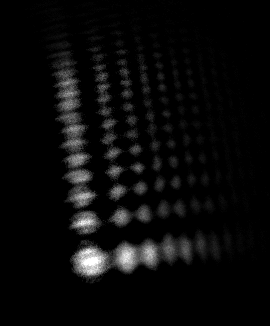
Diffraction
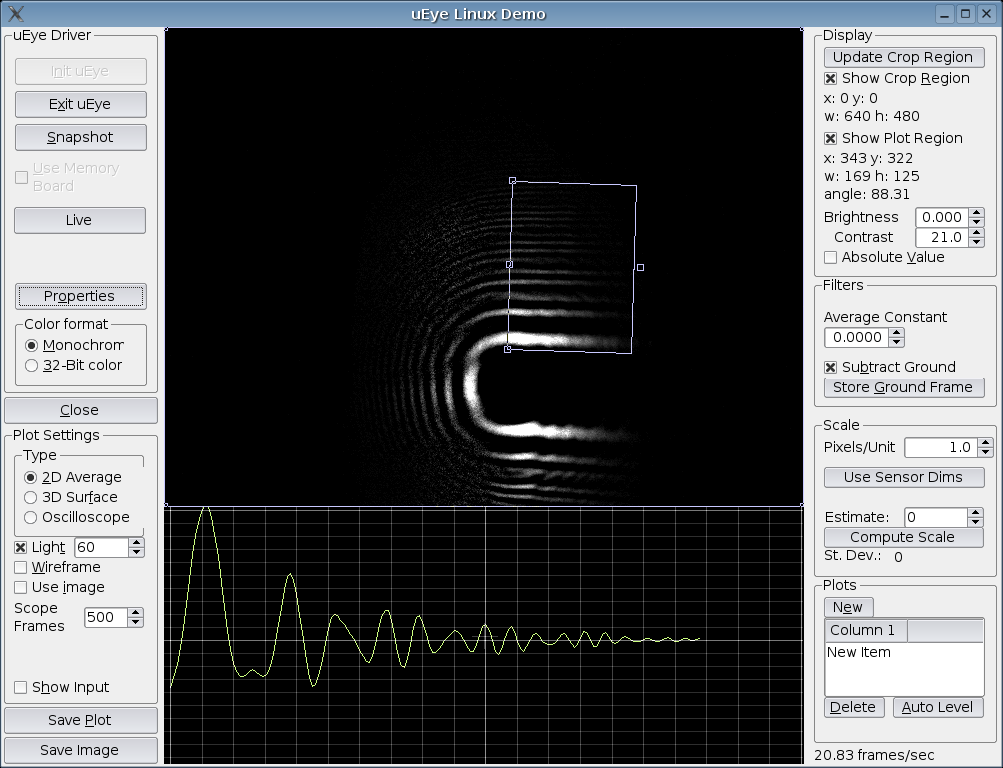
This software is excellent for all types of diffraction measurement because of its intensity plotting capabilities. We typically just look at single or double slit patterns because they produce clean images which require no image processing. However, with background subtraction it is possible to measure diffraction patterns for virtually any shape. The photo to the right is of the shadow from the tip of a small piece of wire. Below is the diffraction pattern of the inside corner of an "L" shaped piece of paper.